A few months ago I started on a little side project to visualize presidential campaign speeches spatially. My idea was to collect speeches by the 2008 US presidential candidates, generate a word cloud of the most common words in each, and each word cloud on a map in the location where the speech was given. We've seen a number of text visualizations and analyses, sometimes in-depth, during this campaign, but so far not by geography that I can recall. (See those from Martin Krzywinski, and The New York Times with help from Many Eyes, for just a few examples.) Are the candidates speaking to different issues in different parts of the country? Are they talking about jobs in Michigan and immigration in New Mexico? Are they pandering to everyone, everywhere they go? (Can we call this project PanderViz?) Visualizing campaign words on a map might answer such questions.

We hoped to develop this idea into a sophisticated interactive map in which a user could search for words, filter speeches by date, and so on. Other work has kept us from doing that before the election next week, but it seems worth showing some screenshots from what I did manage to get done originally.
I went to the official websites of the Obama and McCain campaigns, where the text of speeches is transcribed, and ran the speeches through a simple PHP script to count words and record the location of the speech. This week I revisited the sites to catch up on speeches since the summer. These sources have their drawbacks, of course. For one, although as prepared speeches they contain perhaps the most carefully chosen words for a particular audiences, they do not represent the complete vocabulary used on the campaign trail. Also, Obama's team has been more diligent in posting speeches, it seems, providing close to 80 speeches since May, compared to about 30 for McCain, a disparity that makes comparison between the two candidates a bit difficult.
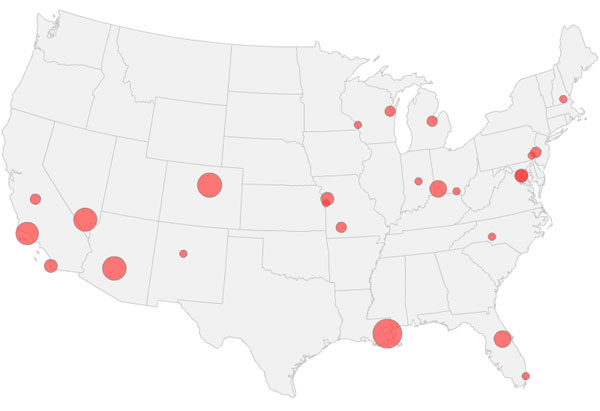
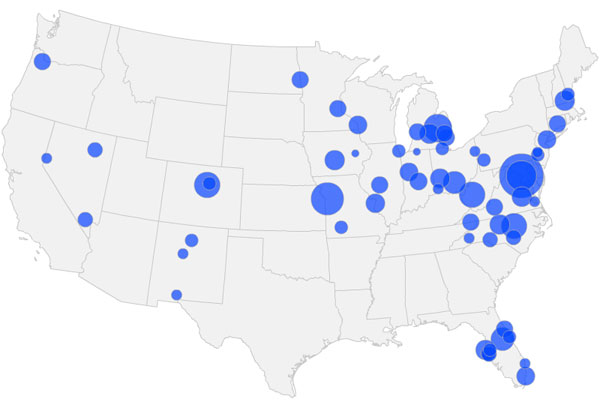
As far as I got with the capabilities of this map was generating scale-dependent word clouds (I've written more about those on my personal site) and searching for individual words to display proportional symbols representing the frequency of use. With less than a week until election day, we might as well get out of it what we can, so I've generated a series of maps of word clouds and individual word frequencies.