Stamen has long been a prolific creative influence in the data visualizatio and mapping world, but perhaps their most best known, instantly recognizable work is still their watercolor map style, developed and released back in 2012. It’s a beautiful, relatively early example of moving beyond the everyday vector graphics language (strokes, fills, etc.) when rendering map data (OpenStreetMap) for the web, and it still remains one of the best.
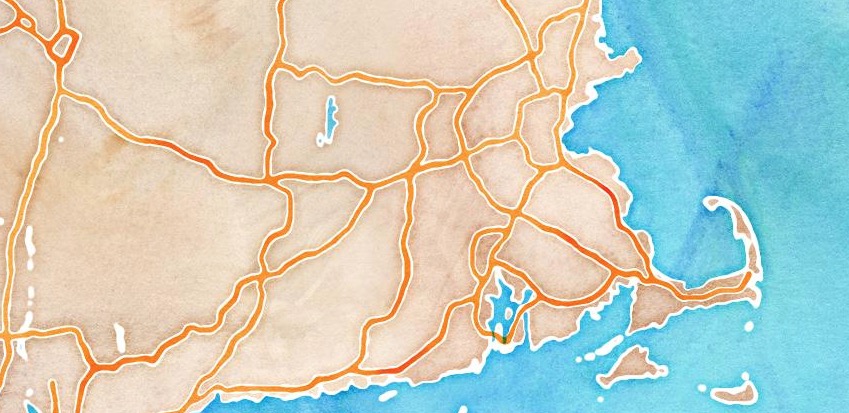
Although the original watercolor map is made of pre-rendered tiles, instricate raster map rendering on the fly in a browser is gradually becoming practical as Canvas becomes more capable, and libraries like D3 make it easy to render vector data to raster graphics. A partial duplication of some of Stamen’s watercolor processes, this time using D3 and Canvas, is a great exercise to hint at what’s possible and spur some new creative ideas in our web maps.
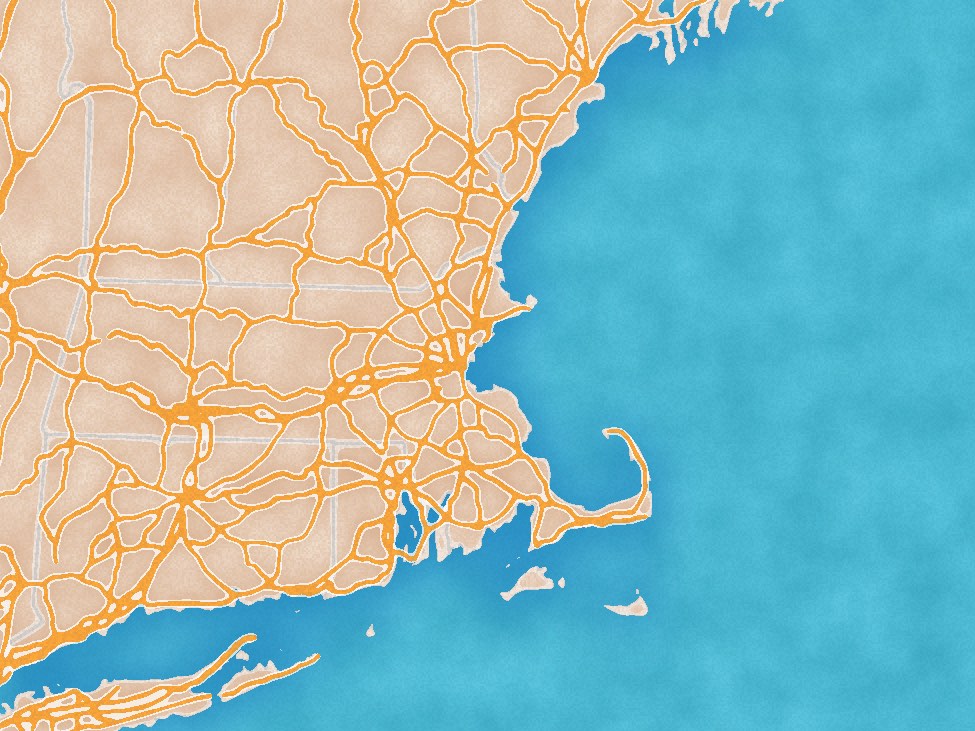
This watercolor map notebook on Observable does that, looking back at Stamen’s techniques as described by the late Zach Watson. (There is further explanation of paint and texture from Geraldine Sarmiento.) It needs to be viewed in the Chrome browser, as some Canvas techniques implemented are experimental and not supported by all browsers.
Advanced map rendering with Canvas tends to involve drawing the same shapes many times as layers and masks are built up, and thus performance may still limit what we can do in realtime without even more advanced technology (WebGL?), but the possibilities are vast and fun nonetheless! Play around with the notebook to see just one example!