We have been experts in the field of interactive mapping for nearly 15 years. During that time, we've helped a diverse group of clients navigate the ever-changing landscape of displaying geographic data on the web. We've advised on data methodologies for international teams, built cartographic and UI spec-sheets for startups, and provided bespoke hosting services tailored to each client's needs.
Contact us today! We'd love to hear more about your project and start thinking about a solution that's right for you.
Spatial data can be messy. We can help you take your spatial data—whatever format it is in—and turn it into structured, organized, machine-readable information.
The data collection processes already in place at your organization are paramount. We can help you by designing new software that brings spatial data to your existing workflows.
If you have or are planning to build a mapping application, we can help you design a basemap and thematic graphics that match your branding, making your maps look uniquely your own.
We pride ourselves in building thoughtful and elegant user interfaces for maps and data visualizations. We can help you with your UI or website design (we even designed this site).
The technology overhead required to get your spatial data or map server online can be immense. Let us help you design a custom solution that is right for your data's purpose and volume.
We are passionate about cartography education. We would love the opportunity to teach your organization about the best practices around visually displaying geographic information.
Custom data entry tools for an interational workforce
The backbone of the imagineRio project is a huge data-collection effort. Scholars and students in the United States and Brazil worked tirelessly to manually digitize geographic features from historic maps and geolocate historic images based on their content. The data collection processes were all done using ESRI tools including ArcGIS Pro and an ArcSDE server, but the imagineRio web-map was built using Mapnik and PostGIS (both open-source). To connect these technology platforms, we built a custom import interface that can be run from the commandline. It guides the user through a series of multiple choice questions, making sure the data they are loading gets routed to the correct place in the database. It has allowed us, with almost no special training, to give the imagineRio project staff the ability to manage and maintain their project's data entirely on their own.
As the project grew, we had an opportunity to integrate a new image repository containing thousands of historic photographs. In addition to integrating new images into the project, we also had to integrate new staff to add the new photographs to the database. As this staff was not based at a university, they did not have access to ArcGIS Pro to use the same workflow as the rest of the team. We built a custom data collection tool
Custom color specs for a major online mapping platform
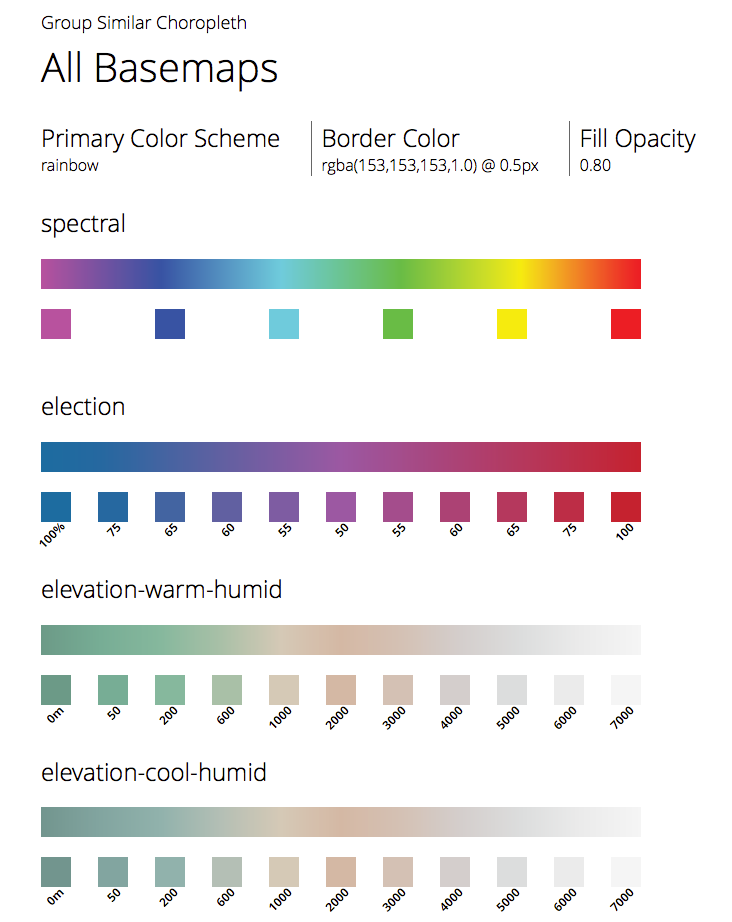
We worked with ESRI to develop an internal color-browser as a test bed for introducing new color schemes to ArcGIS Online. Over 75 custom color schemes were designed for use with thematic data on several built-in basemaps of different styles. Each color scheme is matched both to a particular kind of data and a specific basemap. The goal was to design a wide range of color schemes that would provide users with the best defaults possible when making their maps.
In addition to designing the color schemes and providing detailed color specs, we wanted to make sure the color schemes could be easily communicated internally to the team implementing them in the product. To do this, we build on our experience building ColorBrewer and designed and built a custom color browser for this project. The browser allows users to page through thematic map types, see the color schemes mapped to a test dataset, and view color specifications.
A database and API to support data collection at the UN Food and Agriculture Organization
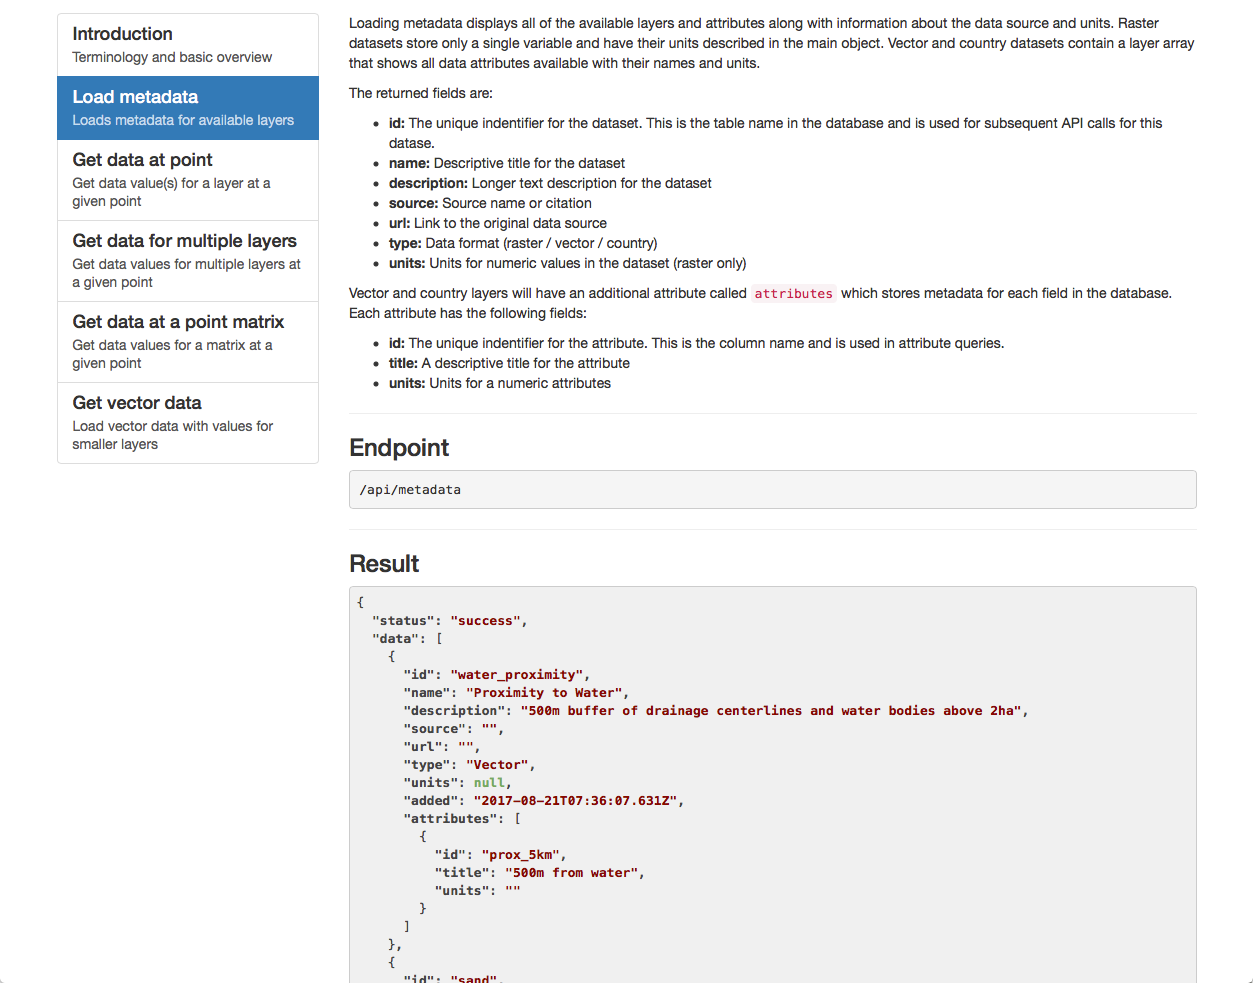
Pure Earch contacted us to support the the data tasks they were performing for the UN FAO. We worked with them to design a fully functional database and API that could handle massive global raster and vector datasets, retrieving data for a given point or a point matrix. The first step was designing and deploying a cloud database to store and serve the geographic data. To populate the database, we build a series of commandline tools in Python. In addition to optimizing and uploading the spatial datasets, the commandline tools also collect and format the apppropriate metadata for inclusion in the database.
The final step was to build the API using the Express framework to manage the API endpoints and parameters. Each database query was tested against the largest datasets available in the project and optimized agianst their execution times. With the API build, we designed an interactive site to allow users to explore the documentation using an interactive environment to test and refine their queries.