We have been making maps to help experts understand and communicate public health data for 10 years. During that time, we've helped a diverse group of clients...
Contact us today! We'd love to hear more about your project and start thinking about a solution that's right for you.
Public health datasets are growing exponentially in size. We can help you create meaning from this data and solve the technical challenge of serving it efficiently.
The data collection processes already in place at your organization are paramount. We can help you by designing new software that brings spatial data to your existing workflows.
Out maps are 100% custom-designed for you and your data. We can help you design maps and thematic graphics that match your branding, making your maps look uniquely your own.
Public health data and maps help shape public policy. To help your users communicate their findings to others, we include export tools in our maps that let them create graphics or reports to disseminate.
Maps and graphics all have inherent weaknesses in how the present data. To ensure your users receive the most complete picture of the data, we build multi-graphic visualization dashboards.
We've built maps for a wide range of users, from experts shaping public policy to general users curious about local health. We target our UI and cartographic design to the expertise-level of the users you're targeting.
Axis Maps worked with us every step of the way to produce a top-of-its-class mapping application, fully customized for our needs. As our project expanded, Axis Maps was able to fully accommodate our additions, building in robust new features that worked seamlessly with existing functionality. We’re thrilled with our final California Healthy Places Index map!
Advanced workflows for expert users influencing policy
When we parterned with The Public Health Alliance of Southern California to redesign and rebuild their Healthy Places Index tool, our goal was to create an interactive online environment that support the work of
Export for policy action
Import data
Custom color specs for a major online mapping platform
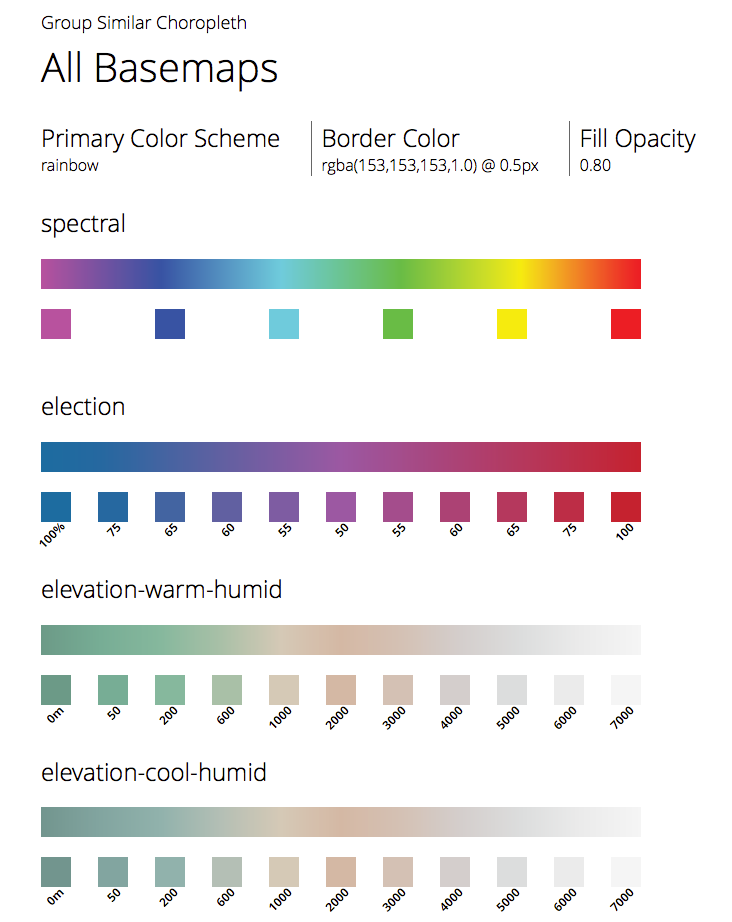
We worked with ESRI to develop an internal color-browser as a test bed for introducing new color schemes to ArcGIS Online. Over 75 custom color schemes were designed for use with thematic data on several built-in basemaps of different styles. Each color scheme is matched both to a particular kind of data and a specific basemap. The goal was to design a wide range of color schemes that would provide users with the best defaults possible when making their maps.
In addition to designing the color schemes and providing detailed color specs, we wanted to make sure the color schemes could be easily communicated internally to the team implementing them in the product. To do this, we build on our experience building ColorBrewer and designed and built a custom color browser for this project. The browser allows users to page through thematic map types, see the color schemes mapped to a test dataset, and view color specifications.
A database and API to support data collection at the UN Food and Agriculture Organization
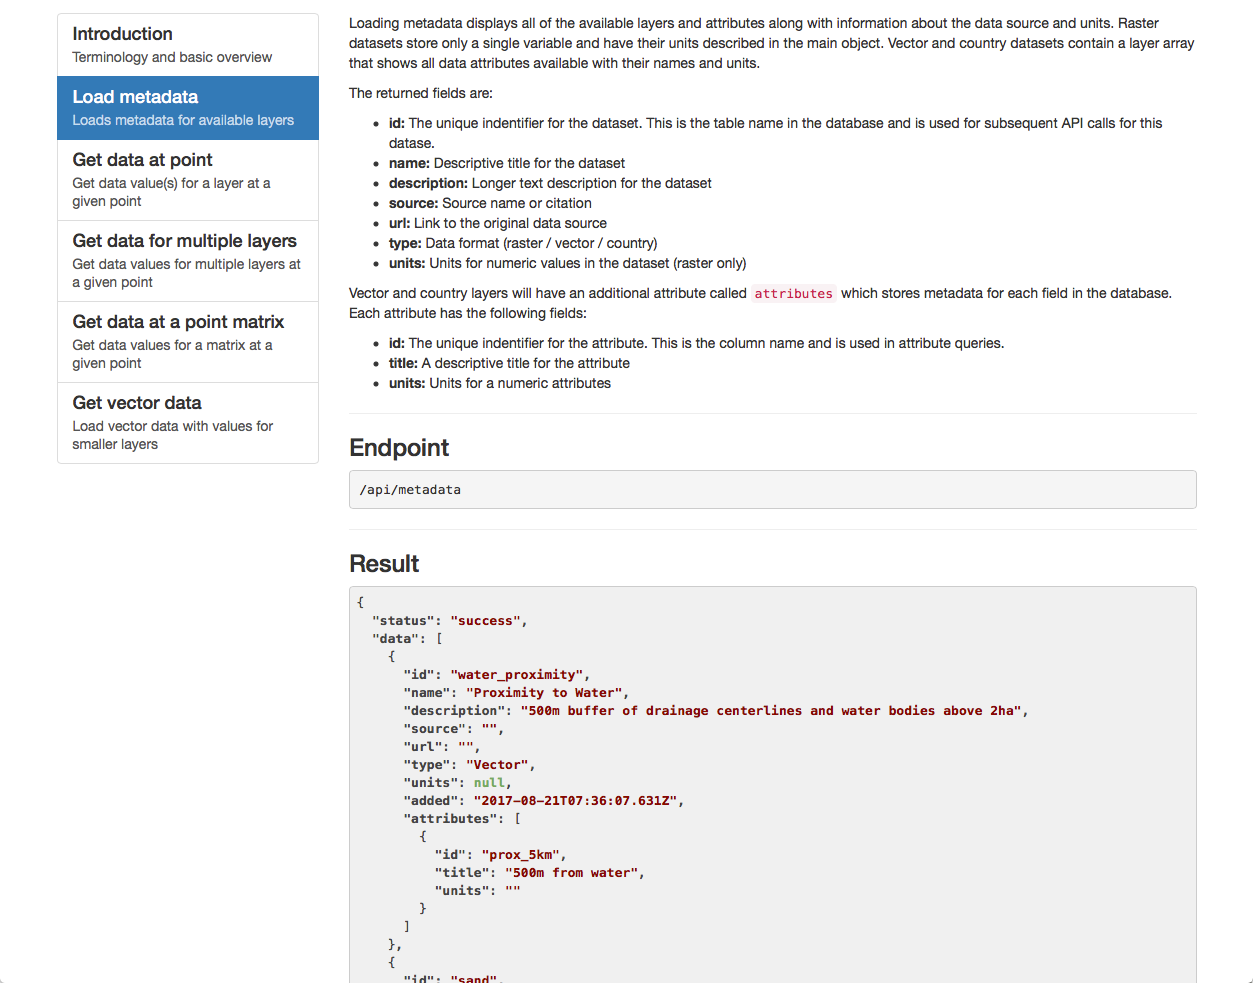
Pure Earch contacted us to support the the data tasks they were performing for the UN FAO. We worked with them to design a fully functional database and API that could handle massive global raster and vector datasets, retrieving data for a given point or a point matrix. The first step was designing and deploying a cloud database to store and serve the geographic data. To populate the database, we build a series of commandline tools in Python. In addition to optimizing and uploading the spatial datasets, the commandline tools also collect and format the apppropriate metadata for inclusion in the database.
The final step was to build the API using the Express framework to manage the API endpoints and parameters. Each database query was tested against the largest datasets available in the project and optimized agianst their execution times. With the API build, we designed an interactive site to allow users to explore the documentation using an interactive environment to test and refine their queries.