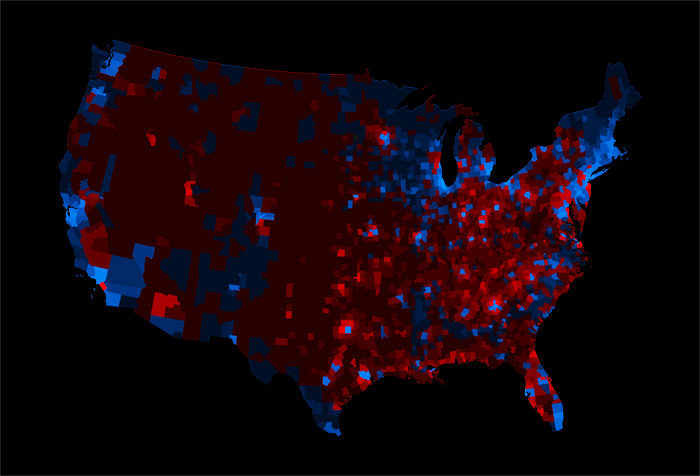
After posting our election map last month, we received a number of excellent comments and suggestions. It's late, but I thought I'd finally post the couple of variations of the map that I've managed to find time to put together. The maps below do two things differently from the original:
- Vary the brightness of counties by population density rather than total population. This was a frequent suggestion. I think it has a few of its own drawbacks too, but it looks pretty good.
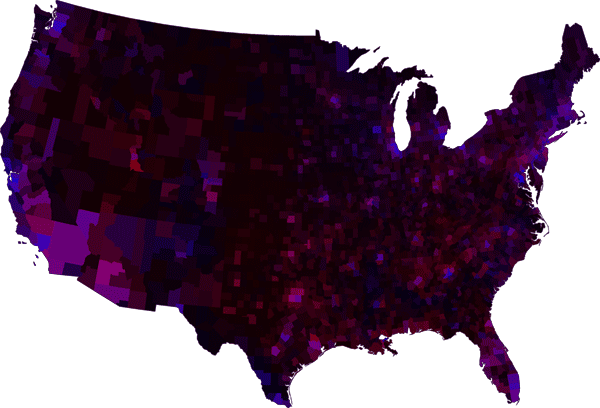
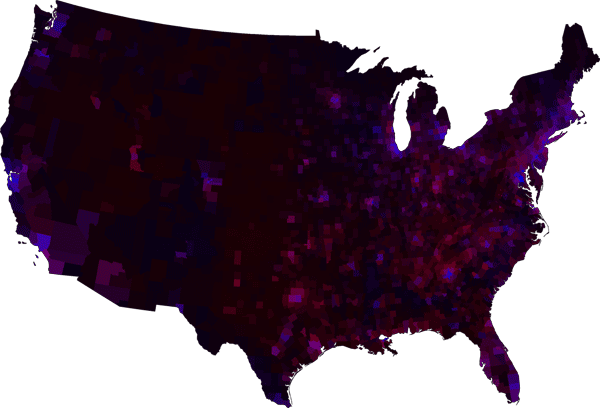
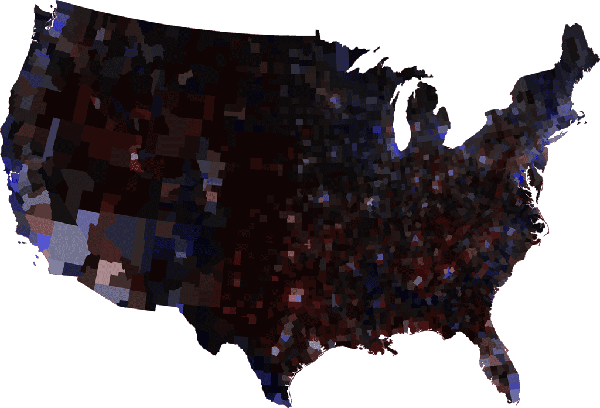
- Different color schemes. Just for fun, I've used the purple color scheme that has become common in recent elections. I also liked the suggestion in one comment to saturate colors by margin of victory, so I've done that too. In these, full blue would be total Obama domination (Obamanation? Obamadom?), full red would be the same for McCain, and gray is an even split.
No snazzy posters this time. Just a few map snapshots.
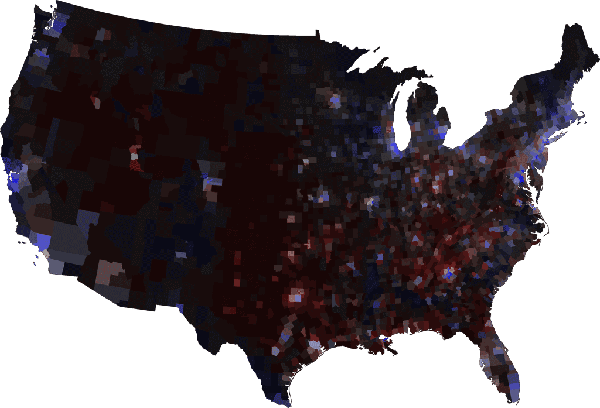
First, the original colors mapped by population density, as posted in the comments on the original post.
The purple color scheme. First by total population:
And by population density:
Margin of victory by total population:
Margin of victory by population density:
Apologies for any trouble seeing the images. It's tricky to find a brightness that will look right on every screen.