When we were building GeoCommons Maker! one of the key map design challenges we faced involved producing semi-transparent choropleth maps. Choropleth maps are perhaps the most common type of thematic map and are regularly used to show data that is attached to enumeration unit boundaries, like states or counties. Ever seen a red state / blue state election map? This is a basic choropleth. There are a lot of more sophisticated ways that choropleths can be made to best represent a given data set, for example, by playing around with classification, categorization, choice of color scheme, etc., but we won't get into those here.
I want to talk about color. Traditionally, choropleth maps are read by looking at the general pattern of unit colors and/or by matching the colors of specific map units to a legend. Other reference data is often removed from the map because it is either, 1) not necessary to communicate the map's primary message or 2) makes communicating this message more difficult. It could be argued, for example, that other reference map information, like green parks, gray airports, brown building footprints, and blue water distract readers from seeing the general pattern of choropleth colors on the map, which is where the map's most important message can be found.
For GeoCommons Maker!, we wanted to allow people to make a kind of hybrid, semi-transparent choropleth map that would show both thematic data (colored choropleth map units) AND the rich reference information on popular map tiles (e.g., Google, Microsoft Virtual Earth) without sacrificing map reading and interpretation ability and confidence. We believe that there are lots of times when reference and thematic data can work extremely well together to really benefit a map's message (e.g., a soils map that shows terrain or a vegetation map that shows elevation). So, we wanted to build this functionality into Maker!, and allow people to make maps that show the best of both worlds.
The Problem with Transparency
The fundamental problem with transparency is that the color of semi-transparent map units can shift due to the visibility of color that lies beneath them. This is not at all surprising, but can make the basic legend matching task difficult, obscure the pattern of color on the map, or just as bad, make patterns appear out of nowhere. Here's a look at what happens to colors using the same semi-transparent choropleth map units on different backgrounds. These are screen captures from early design mock-ups for Maker!.
The first image shows (hypothetical) opaque choropleth map units with a 7-class color ramp. The next three images show the same units at 50% opacity on top of Google terrain, streets, and satellite imagery. Notice how colors shift when compared to the opaque map at top? See how lightly colored units nearly disappear on the streets map, and darkly colored units nearly disappear on the satellite map? Yikes!
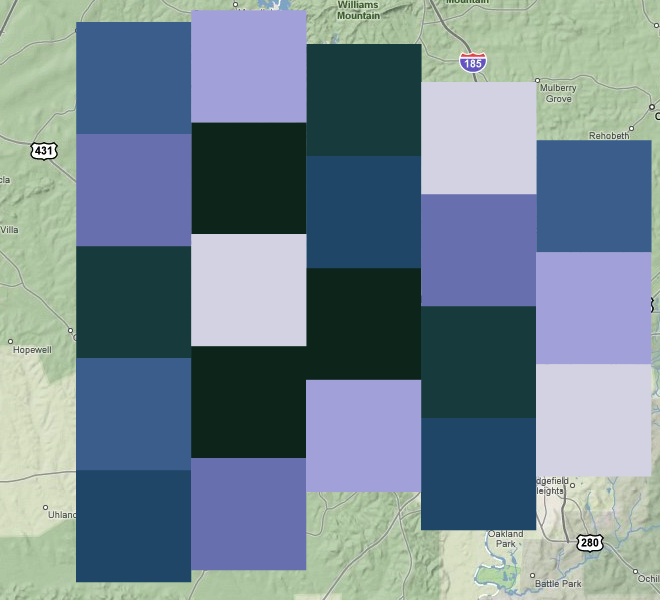 Mock-up of an opaque, 7-class choropleth map for Maker! (Google terrain)
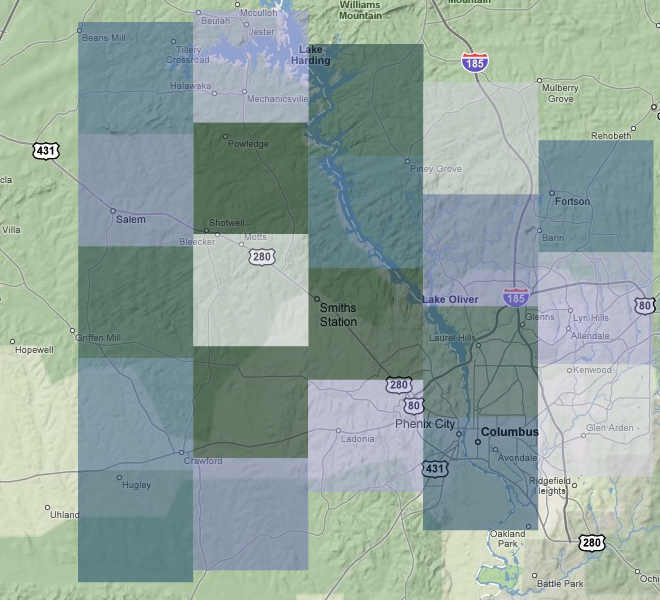 Same mock-up, at 50% opaque (Google terrain)
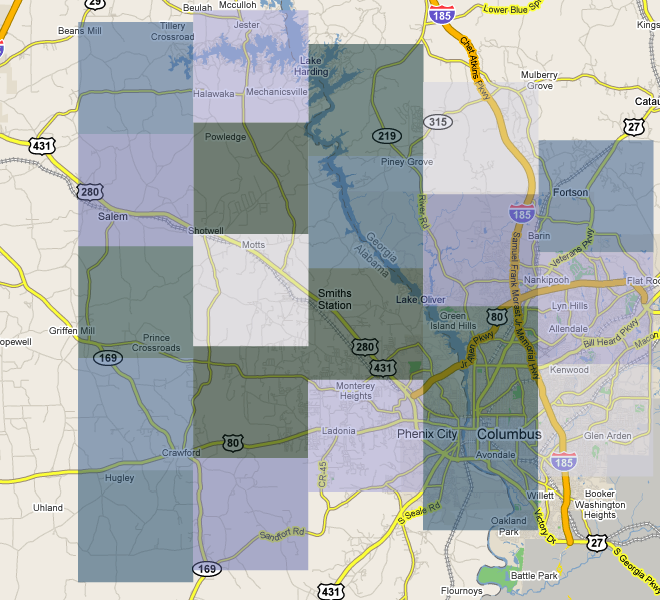 Same mock-up, at 50% opaque (Google streets)
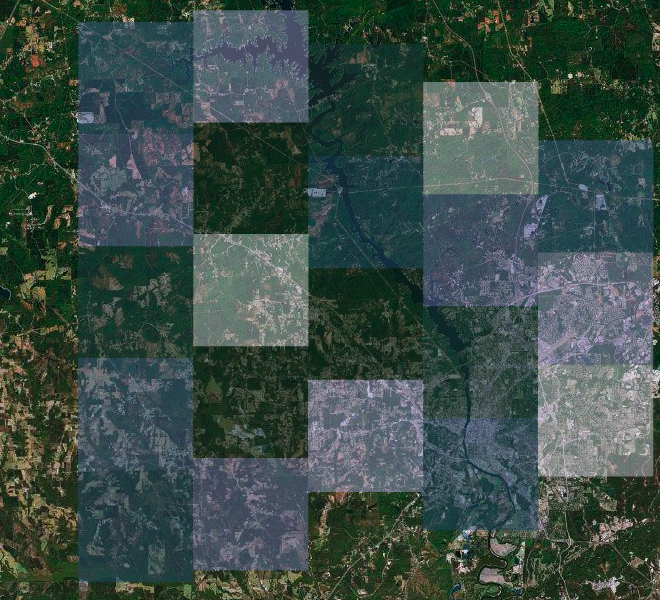 Same mock-up, at 50% opaque (Google satellite)
The Solution to Transparency
We employed three design solutions to ensure that semi-transparent choropleth maps in Maker! would work, despite potential map reading problems: 1) unit boundaries, 2) data probing, and 3) transparency control.
1) Unit boundaries. In Maker's choropleth maps unit boundaries are color coded but remain opaque, even when unit fill color is semi-transparent. This gives map users some true color information to work with, and should improve their ability and confidence to spot map patterns or match colors to a legend. In other words, while unit fill colors can get you close, unit boundaries can get you the rest of the way there.
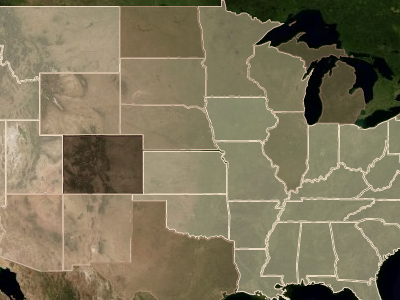 Screen-shot from Maker! showing opaque choropleth unit boundaries
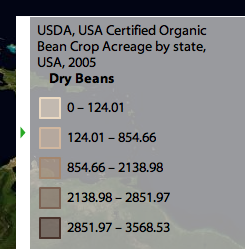 Corresponding legend for the above map
2) Data probing. We also took advantage of a relatively common and very helpful interactive map feature known as data probing. Exact values for any choropleth map unit can be obtained by clicking on them. In Maker!, we designed the data probing feature to go one step further and give values for all of the possible attributes associated with each map unit, not just the mapped attribute alone (see the scrolly list, shown in the probing pop-up below).
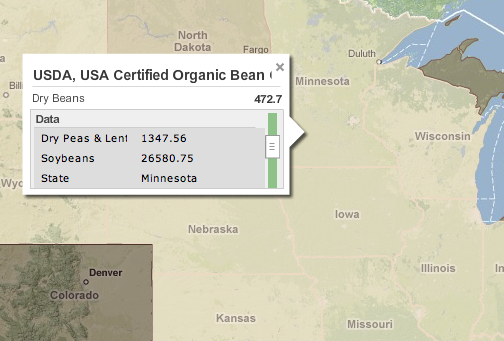 GeoCommons Maker! Data Probe
3) Transparency control. Finally, we gave mapmakers a transparency control, as well as a chance to take some responsibility for how well their maps communicate. The transparency control lets mapmakers decide what works and what doesn't. Given the huge range of possible maps that can be made with Maker!, some user controls like this are necessary (as well as being kinda fun!). Here, transparency can be adjusted for a custom fit with any chosen tile set, color scheme, or other mapped data. Settings on the control (shown below) range from 50-100% opaque.
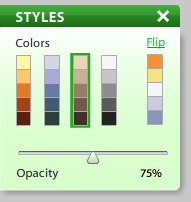 Screen-shot from Maker! showing the transparency control
The Best of Both Worlds
Our decision to include semi-transparent choropleth maps in Maker! should give mapmakers and map users the best of both worlds. A semi-transparent choropleth is truly a hybrid map in that it can potentially offer all the advantages of combining rich reference data (i.e., underlying tile sets) with great thematic data (i.e. overlying choropleth units). Hopefully the choropleth maps coming out of Maker! will be easy to read and good looking, too!