We’re a mapping company that’s most at home on the web. So when a more traditional static cartography job came along, we even took that to the web.
The ongoing project involves producing a set of four maps for each of thirty-three different countries, showing GDP along with flood and earthquake risk. To make 132 maps, clearly we need to set up a good, easily-repeatable workflow. Because the map themes and symbologies are the same for each country, essentially we need a set of templates into which we can throw some data and get an appropriately styled map that we can export for refinement in Illustrator, and finally layout in InDesign.
Ordinarily that’s where GIS software like QGIS or ArcGIS comes in. But using GIS can be a slow, repetitive task. In the interest of creating a faster process suited to our purpose specifically, we thought it would be easier to develop our own web-based tool to handle the parts of the workflow normally handled by GIS. Fortunately, it’s easy to do such a thing with D3.
Here’s a shot of the tool. It looks rough, certainly, but it does its job: quickly get a country map as close as possible to final form, ready to be dropped into our Illustrator and InDesign templates.
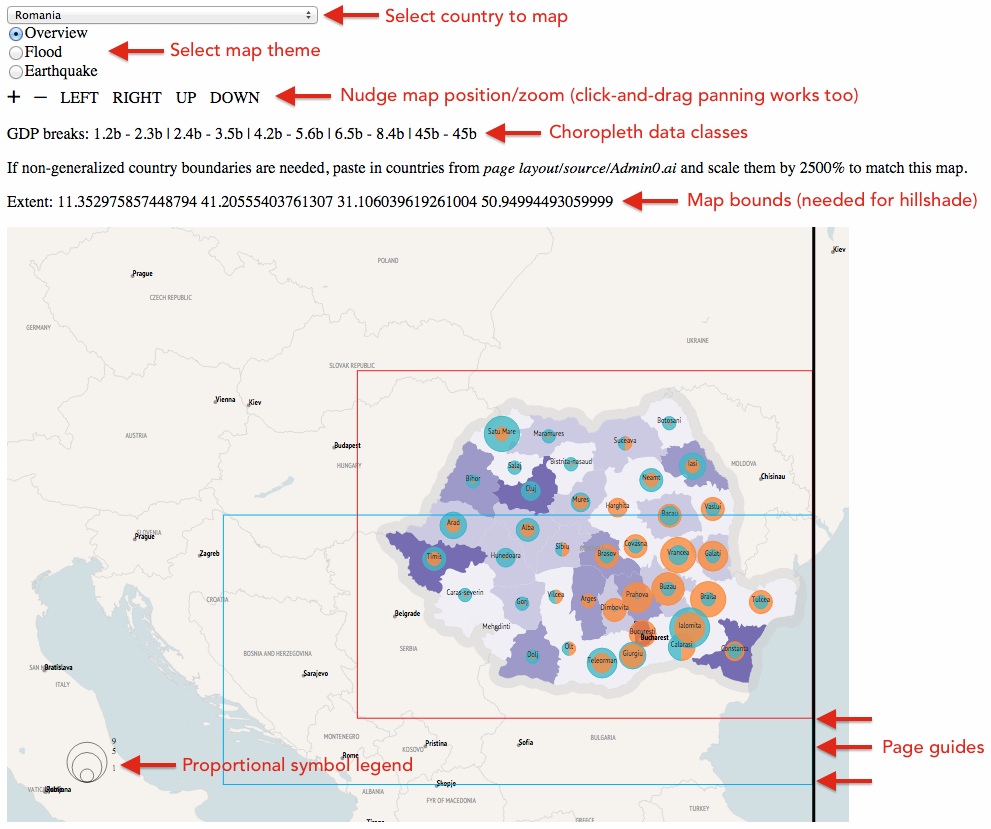
In contrast to GIS, there are only a couple of moving parts here. All we have to do is select a country, adjust the map position and scale, and choose the map theme. Everything else is automated. For me, someone who usually accomplishes cartography via web development, it was a lot easier and faster to build this simple customized tool than to figure out how to get GIS to do exactly what we want. It’s also easy to keep up with any change requests, which usually only mean a few lines of code.
Below is a bit more about how this thing works, which leads to some tips we’ve learned about using a D3 web map in a static cartography workflow.
Data
Data here are in two forms: topojson for the map layers (boundaries, cities, lakes, etc.) and CSV for the numeric data. All are loaded at runtime, where the CSV is joined to Admin 1 (province-level) geodata. We avoided pre-joining the CSV to the shape data because that would make updates more complicated, i.e., saving a new topojson file for any little data change.
Page setup
It’s important to get sizes and positioning exactly right so that the exported map drops perfectly into our templates without the need for any transformations. Our maps are A4 size and we’re working in millimeters, but of course in the browser we need pixel dimensions. It works out to be 841.89 x 595.28 pixels. Illustrator converts measurements at 72 pixels per inch, which is a lower resolution than modern screens, and thus the map appears suspiciously small in the browser—but don’t worry, it all turns out right in the end!
It’s also important to note the lat/lon bounds of the map in case outside geodata needs to match. In this case we generate a hillshade separately using GDAL. The extent values listed above the map—easily derived from D3’s projection.invert() method—plug right into the GDAL commands, producing a hillshade image that will fit perfectly on this map.
Map layout
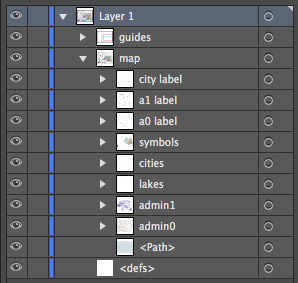
D3 really shines with projecting and drawing geographic data, and this tool takes full advantage of that. It goes through the standard routine of drawing GeoJSON data to SVG paths, putting each data layer into a named <g> element that will later show up as a layer in Illustrator. We use the Mercator projection (sorry, cartographic hard-liners, it was by request) and use D3’s geo centroid() and bounds() functions to center the map on the country of interest and scale it approximately to fit. After that we can manually adjust position or scale to get the layout just right, fitting the country into some guides we added on top of the map.
Importantly, in addition to the standard map-drawing code, we use the projection’s clipExtent() method to clip everything to the page extent. Otherwise, when imported to Illustrator, we’d have a whole world’s worth of extraneous paths outside the artboard. While setting the clipExtent is enough to chop off polygons and anything drawn directly with the path generator, hiding labels takes a little extra effort. We have to check manually whether they’re outside the clip extent and hide them if so.
countryLabels.selectAll("text")
  .each( function(d){
    var c = path.centroid(d);
    if ( !isNaN(c[0]) && !isNaN(c[1]) ){
      d3.select(this)
        .attr({
          x: c[0],
          y: c[1],
          opacity: 1
        })
    } else {
      d3.select(this)
        .remove();
    }
  });
Thematic symbols
D3’s scale functions really come in handy for these maps’ thematic layers. For the most part, we can create scales that have a constant range (such as the purple color scheme or the proportional symbol size) and set the domain to according to a particular country’s data if needed. GDP data (the choropleth map) is classified using the Jenks algorithm in Simple Statistics.
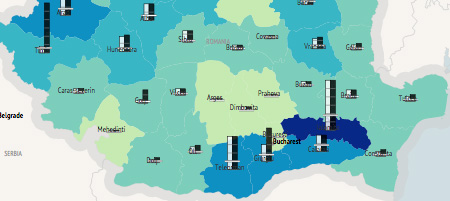
For the most part we leave legends to the Illustrator end of things. Values of the choropleth class breaks are simply listed in the containing HTML page, and then entered into the template in Illustrator. We do draw a simple proportional symbol legend because while the maximum size is constant, the size of good sample values (such as 1 or 5) changes from map to map. Flood and earthquake maps use bar chart symbols that, like the choropleth map, simply get some explanation in text.
Mapping via code provides a big advantage if you’re looking for complex symbols. D3 in particular makes it easy to draw symbols tied to data—with almost total freedom of form.
Export
Luckily, there’s not a lot to explain here. SVG Crowbar, created by New York Times Graphics people specifically with D3 in mind, does a great job of exporting the SVG map to a layered file ready to use with Illustrator. We just have to make sure our various map layers are properly grouped and have id attributes, and we end up with a nice and neat file.
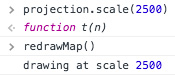
A command line
Finally, a nice thing about doing the basic map work in the browser is that it’s easy for a web developer to do advanced things by entering code right in the console, without having to be familiar with more specialized code that might be used in GIS or other tools. We didn’t do much of that here, other than as a shortcut to set zoom levels, but theoretically we could invoke, change, or extend any other functions of the page to do things that might be needed in unique cases.
Coder-friendly mapping
In closing, it merits noting that this kind of workflow might be good for us (and people like us) because JavaScript is much of what we do on a day-to-day basis. Everything that I’ve said is “easy” with D3 is, well, very difficult if you’re unfamiliar with this kind of coding. A good philosophy and habit is to use the right tool for the job, but it’s also wise, for expediency’s sake, not to dismiss just using the tool that you know. Sometimes the right tool is the easy tool.